Instructions
| Table of contents |
|---|
| 1. Logging in |
| 2. The structure of a flowchart |
| 3. Editing content |
| 4. Adding images |
| 5. Embedding video |
| 6. Adding links |
1. Logging in
Go to https://flowcharts.mwav.org/admin/ and login.
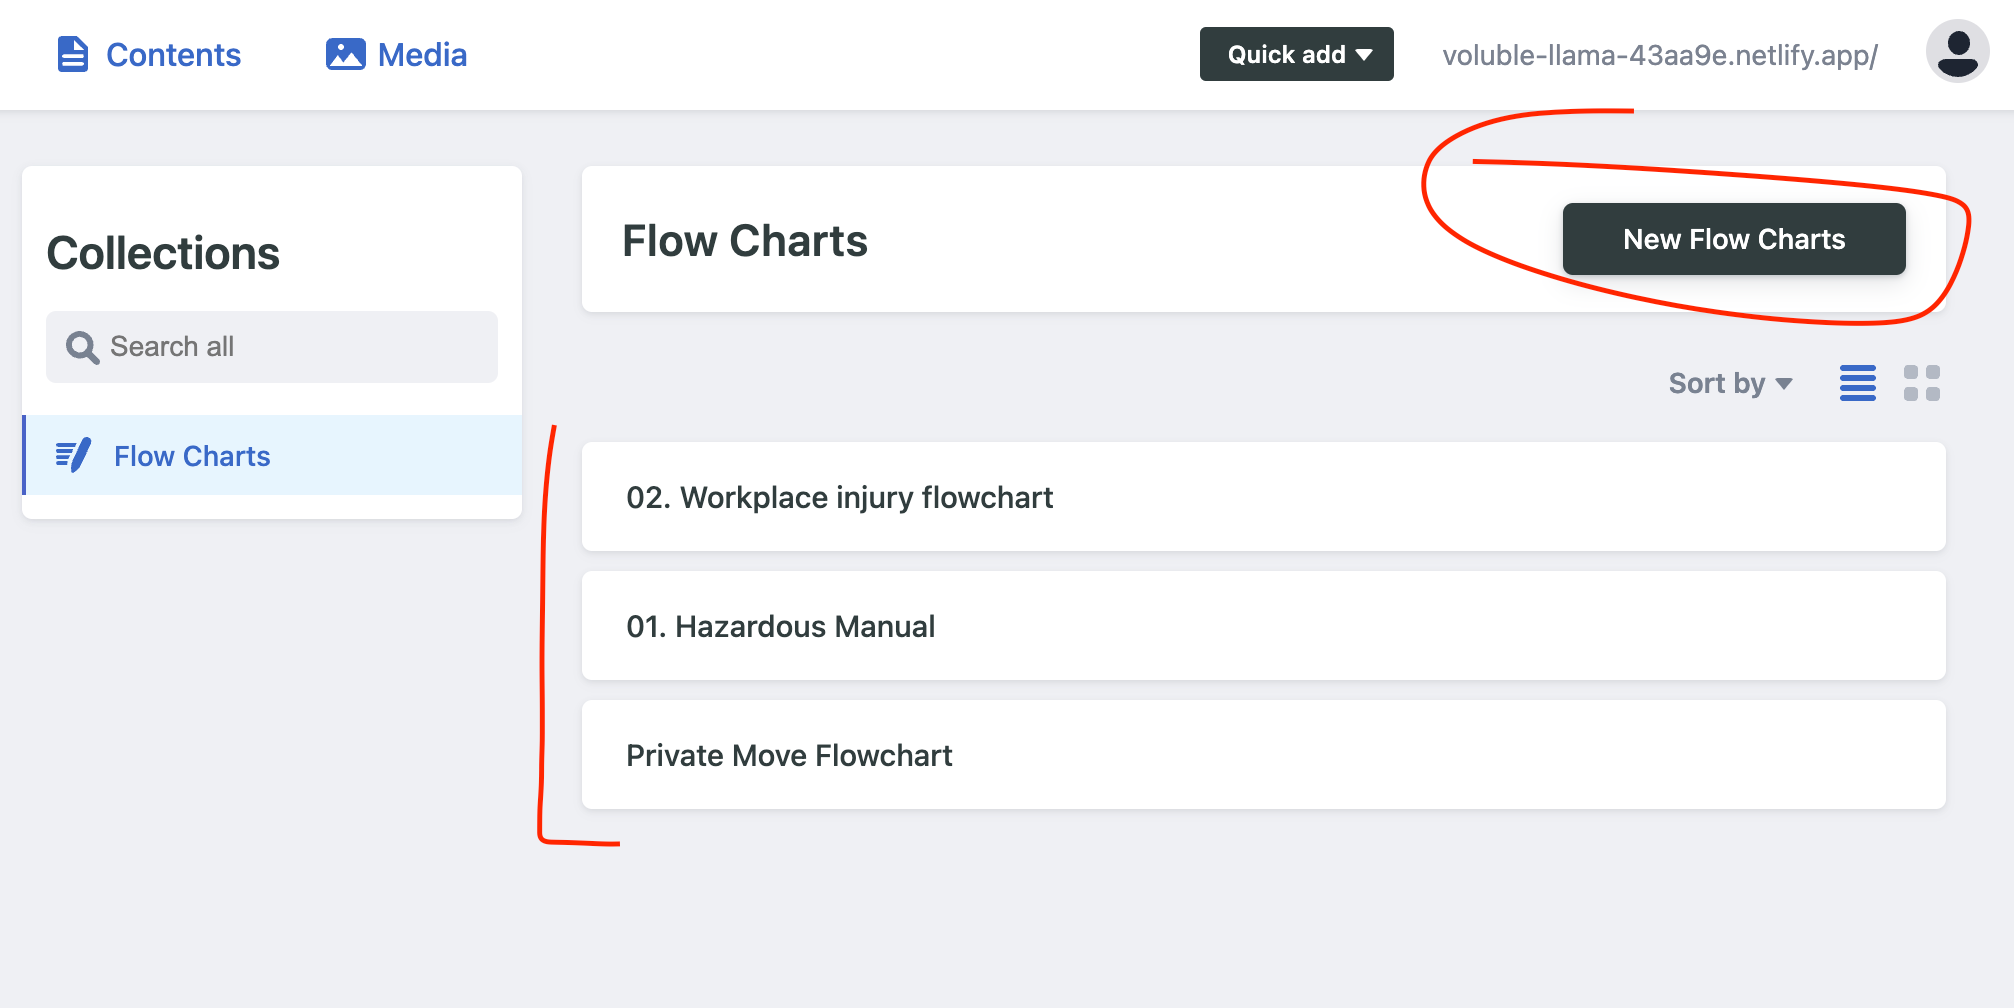
You'll be presented with a list of charts that you can edit or add new ones to.
2. The structure of a flowchart
Flowcharts have unique urls that are determined by their title.
All flowcharts are listed here and those urls can be used to embed individual flowcharts in embeds within the WIKI.
It's recommended to make the iframes when embedded to be at least as high as the average desktop and mobile screen.
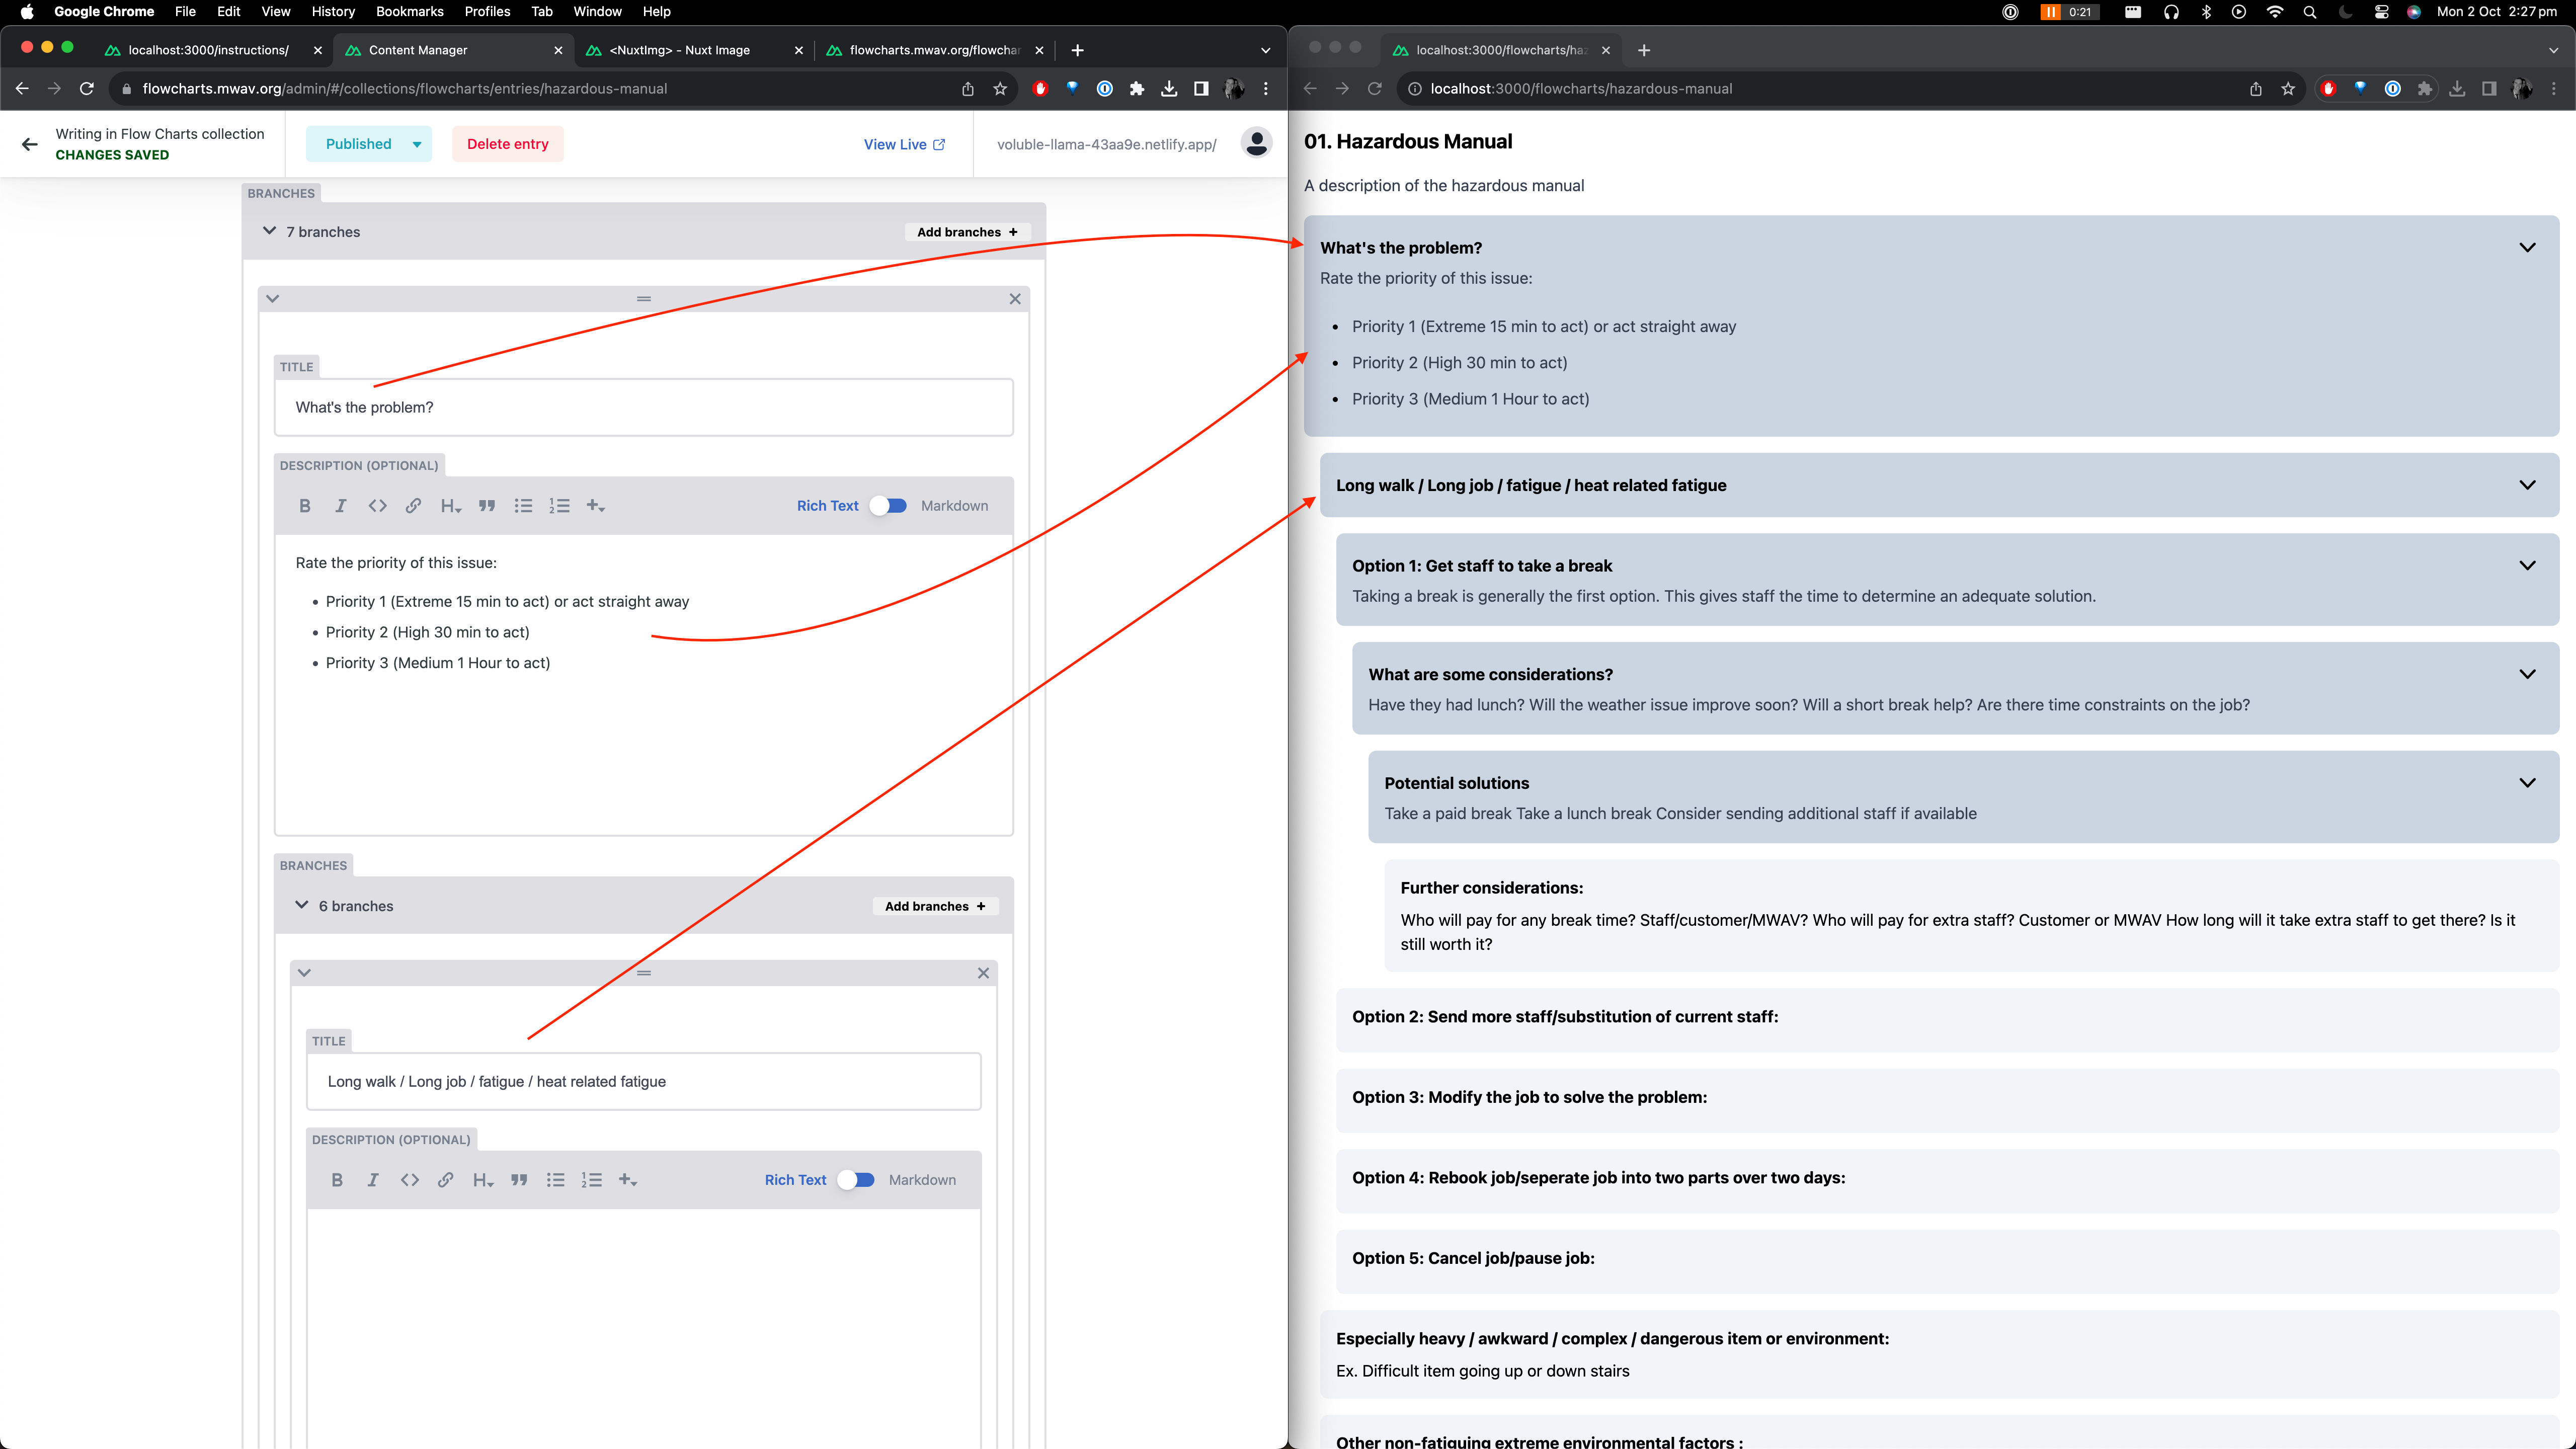
The image above attempts to show the basic structure of a flowchart which can next up to 7 levels deep to allow for a lot of flexibility when presenting question/answer based information.
Essentially branches can be nested within other branches.
3. Editing content
When editing content description fields, they can be edited in either Rich Text or Markdown views.
Rich text is fine for most cases but if you need to clean up formatting issues when pasting in from word documents or similar check the markdown view.
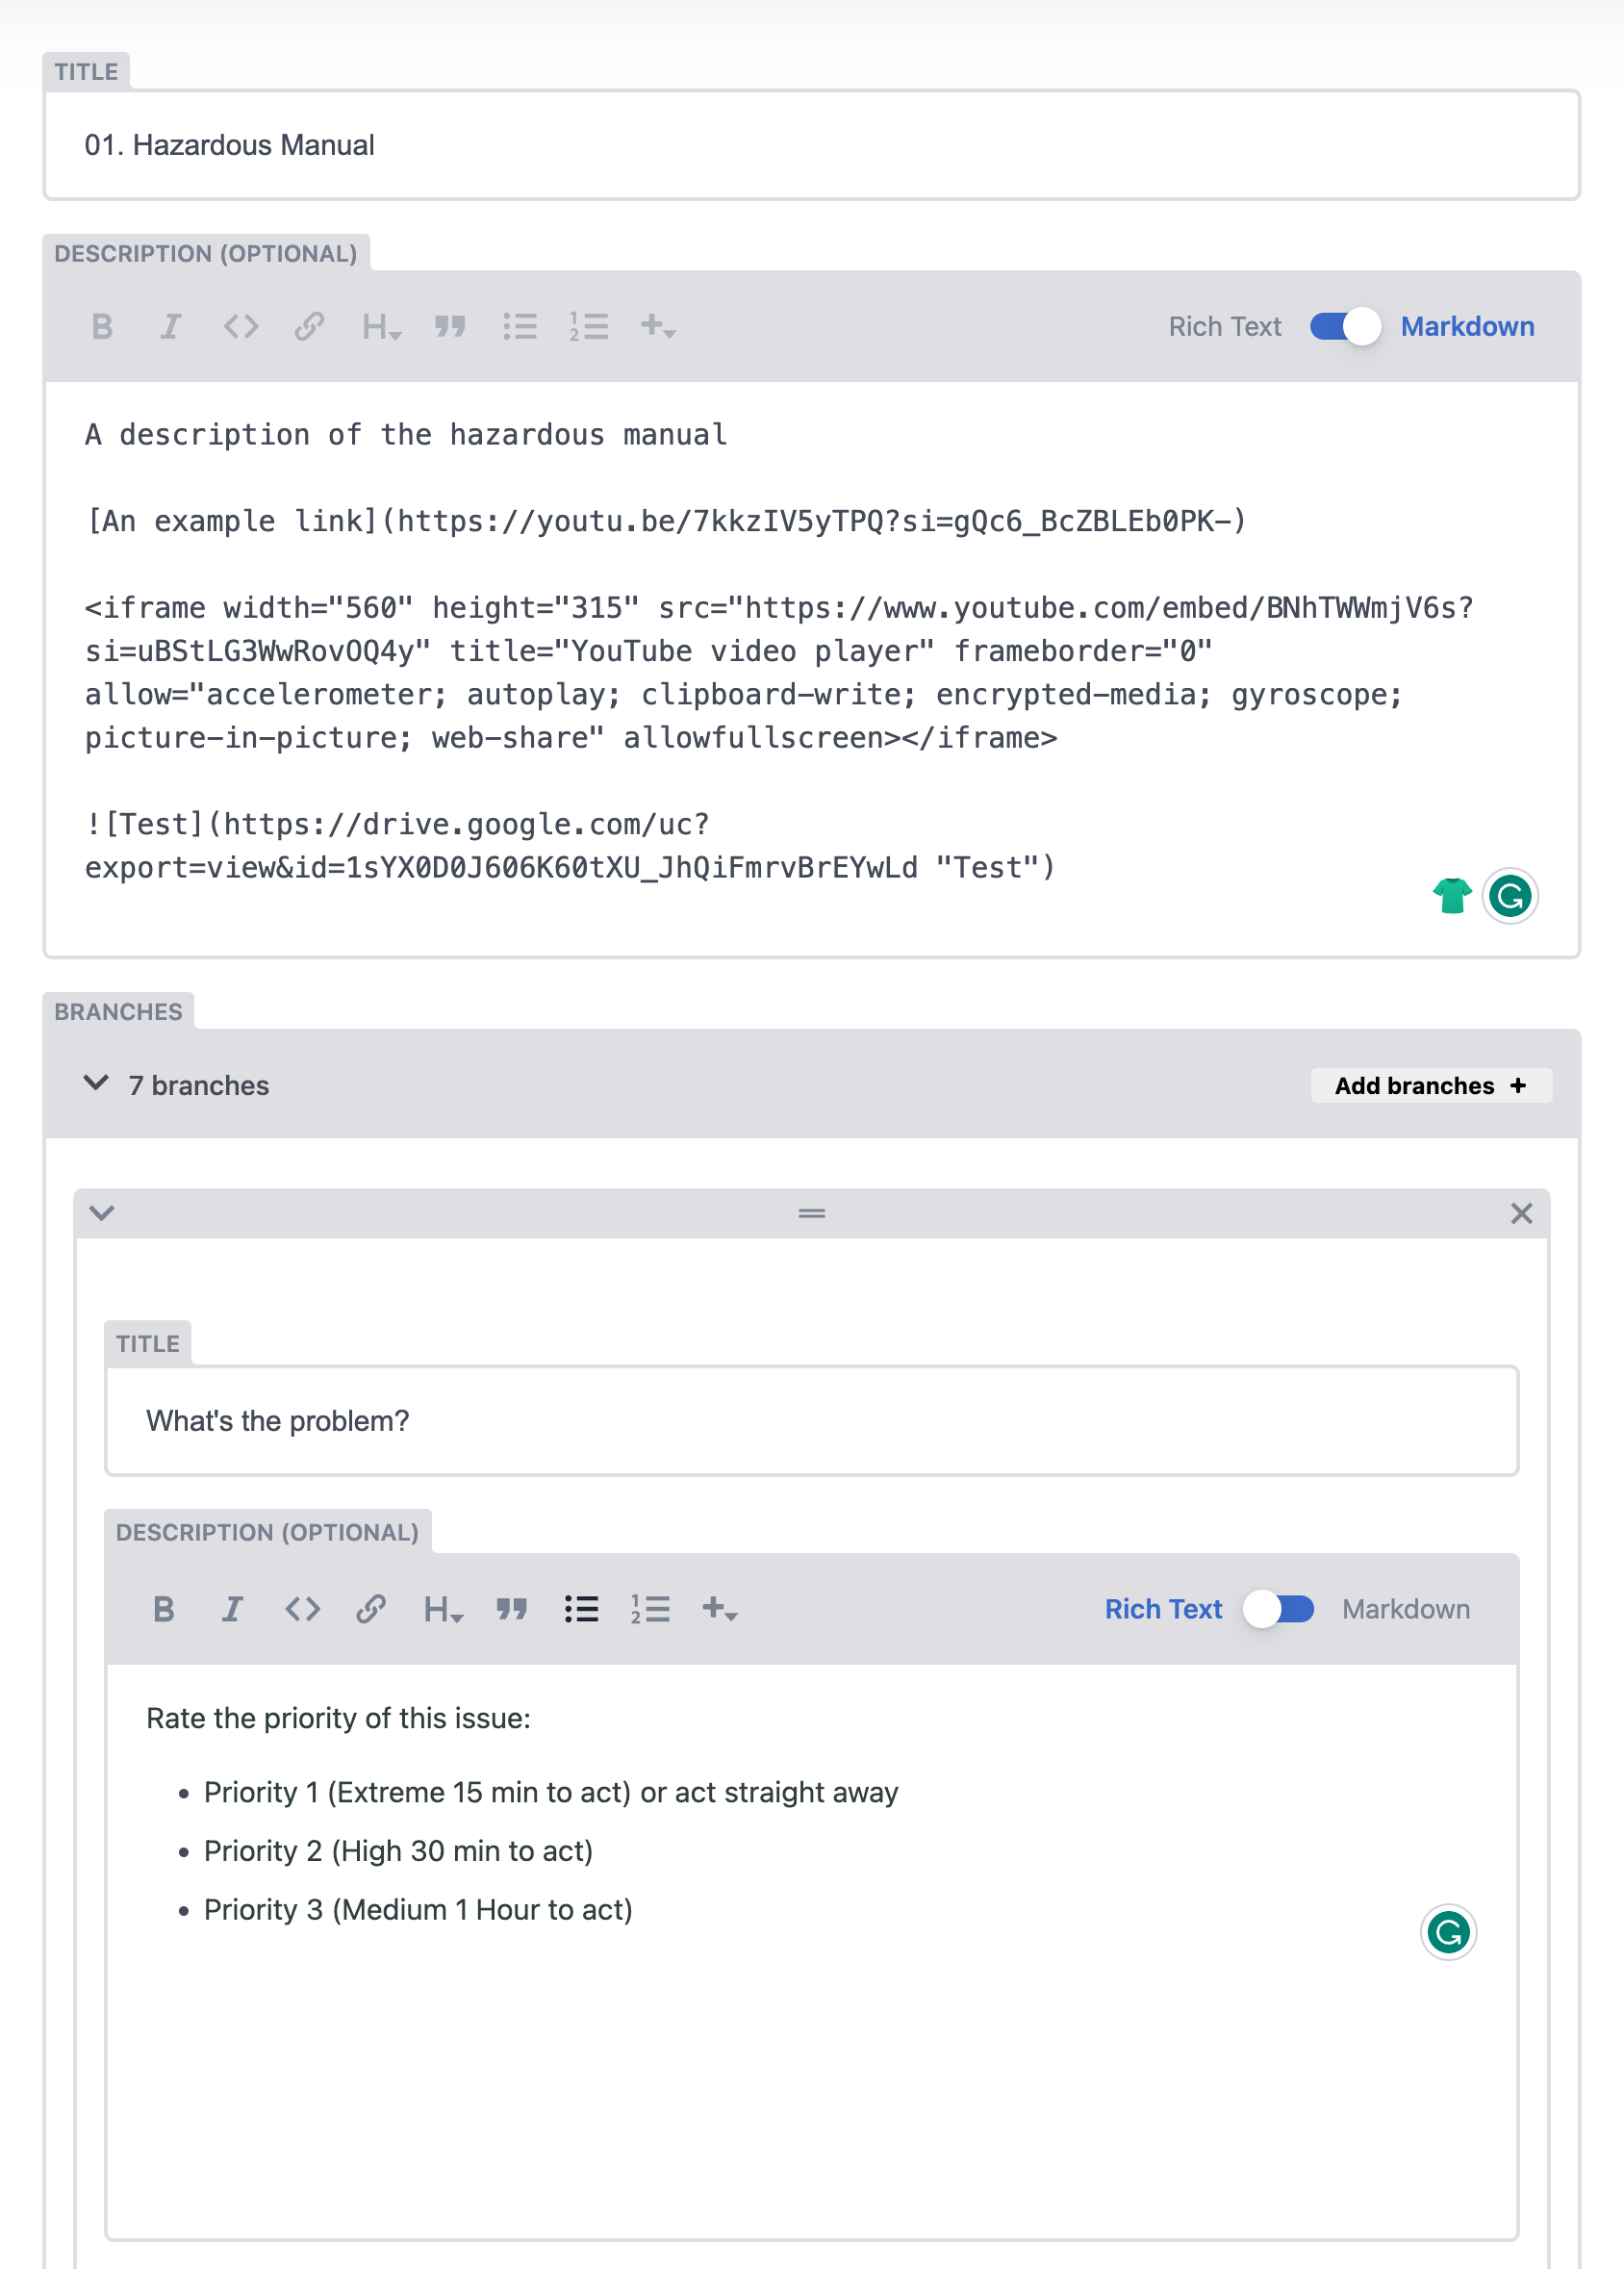
The WYSIWYG editor outputs markdown for formatting in the background which looks like the image below which is the equivelant of the Rich text editor above
4. Adding images
Images can be added directly to flowcharts.
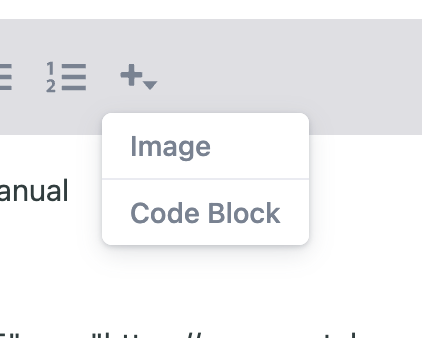
To do so, click the plus icon and then select "image" from the dropdown.
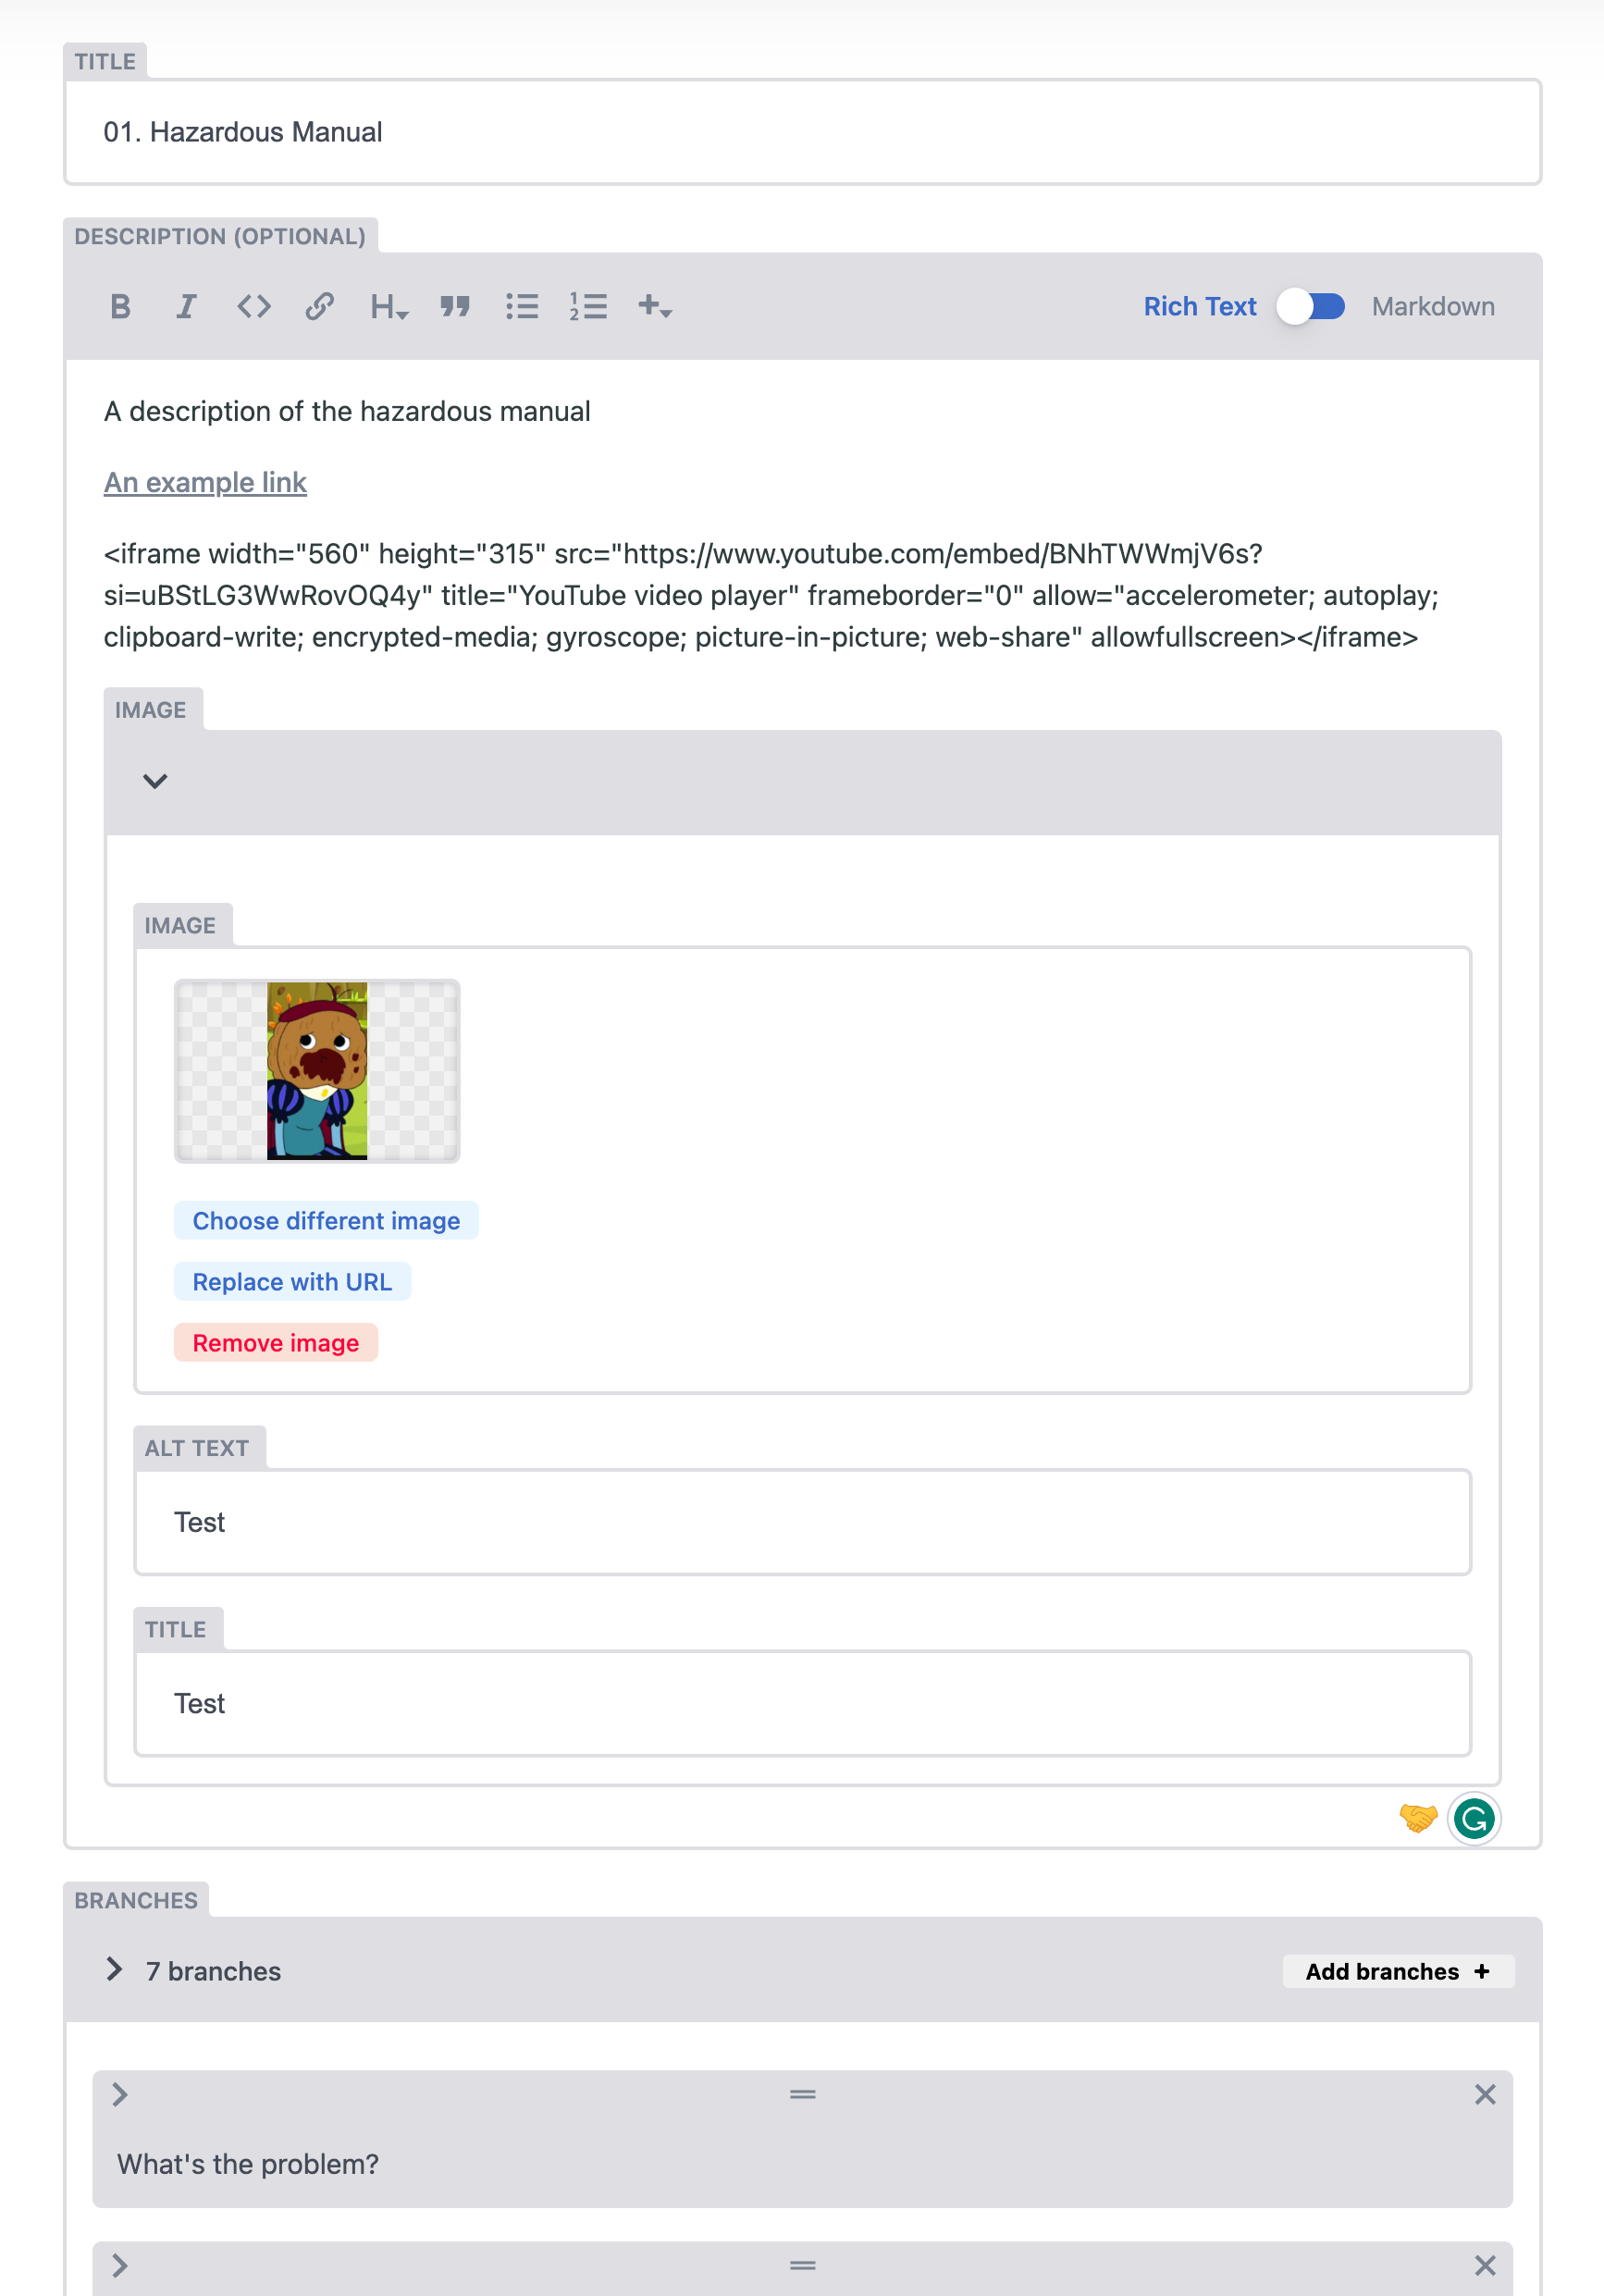
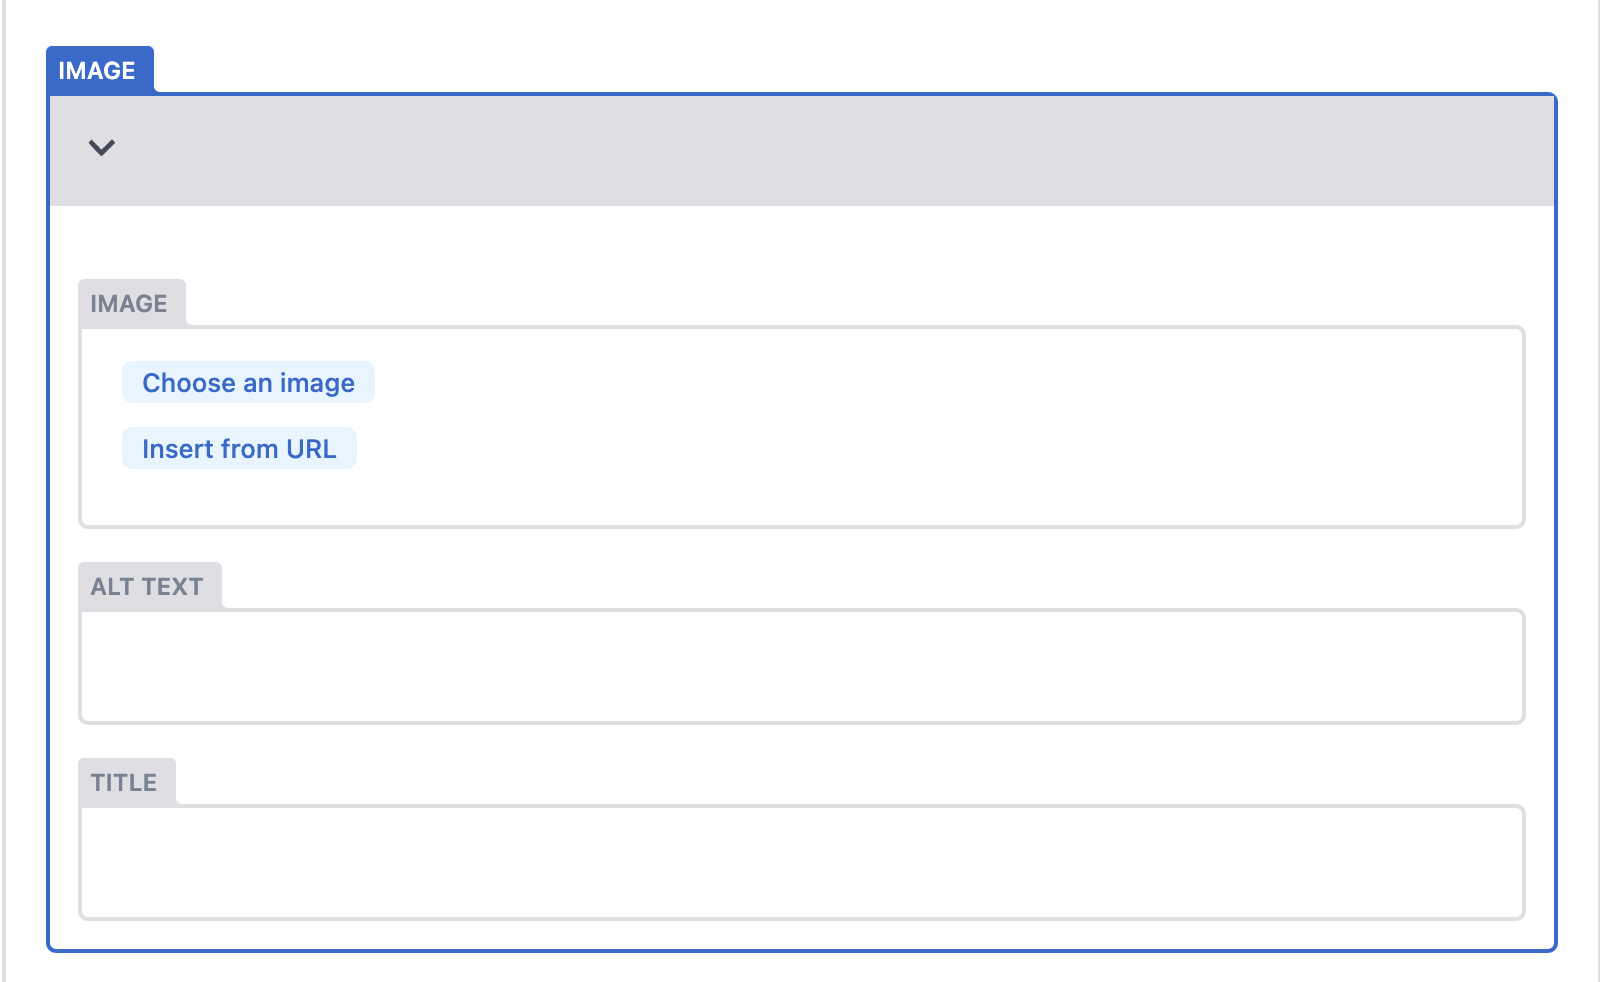
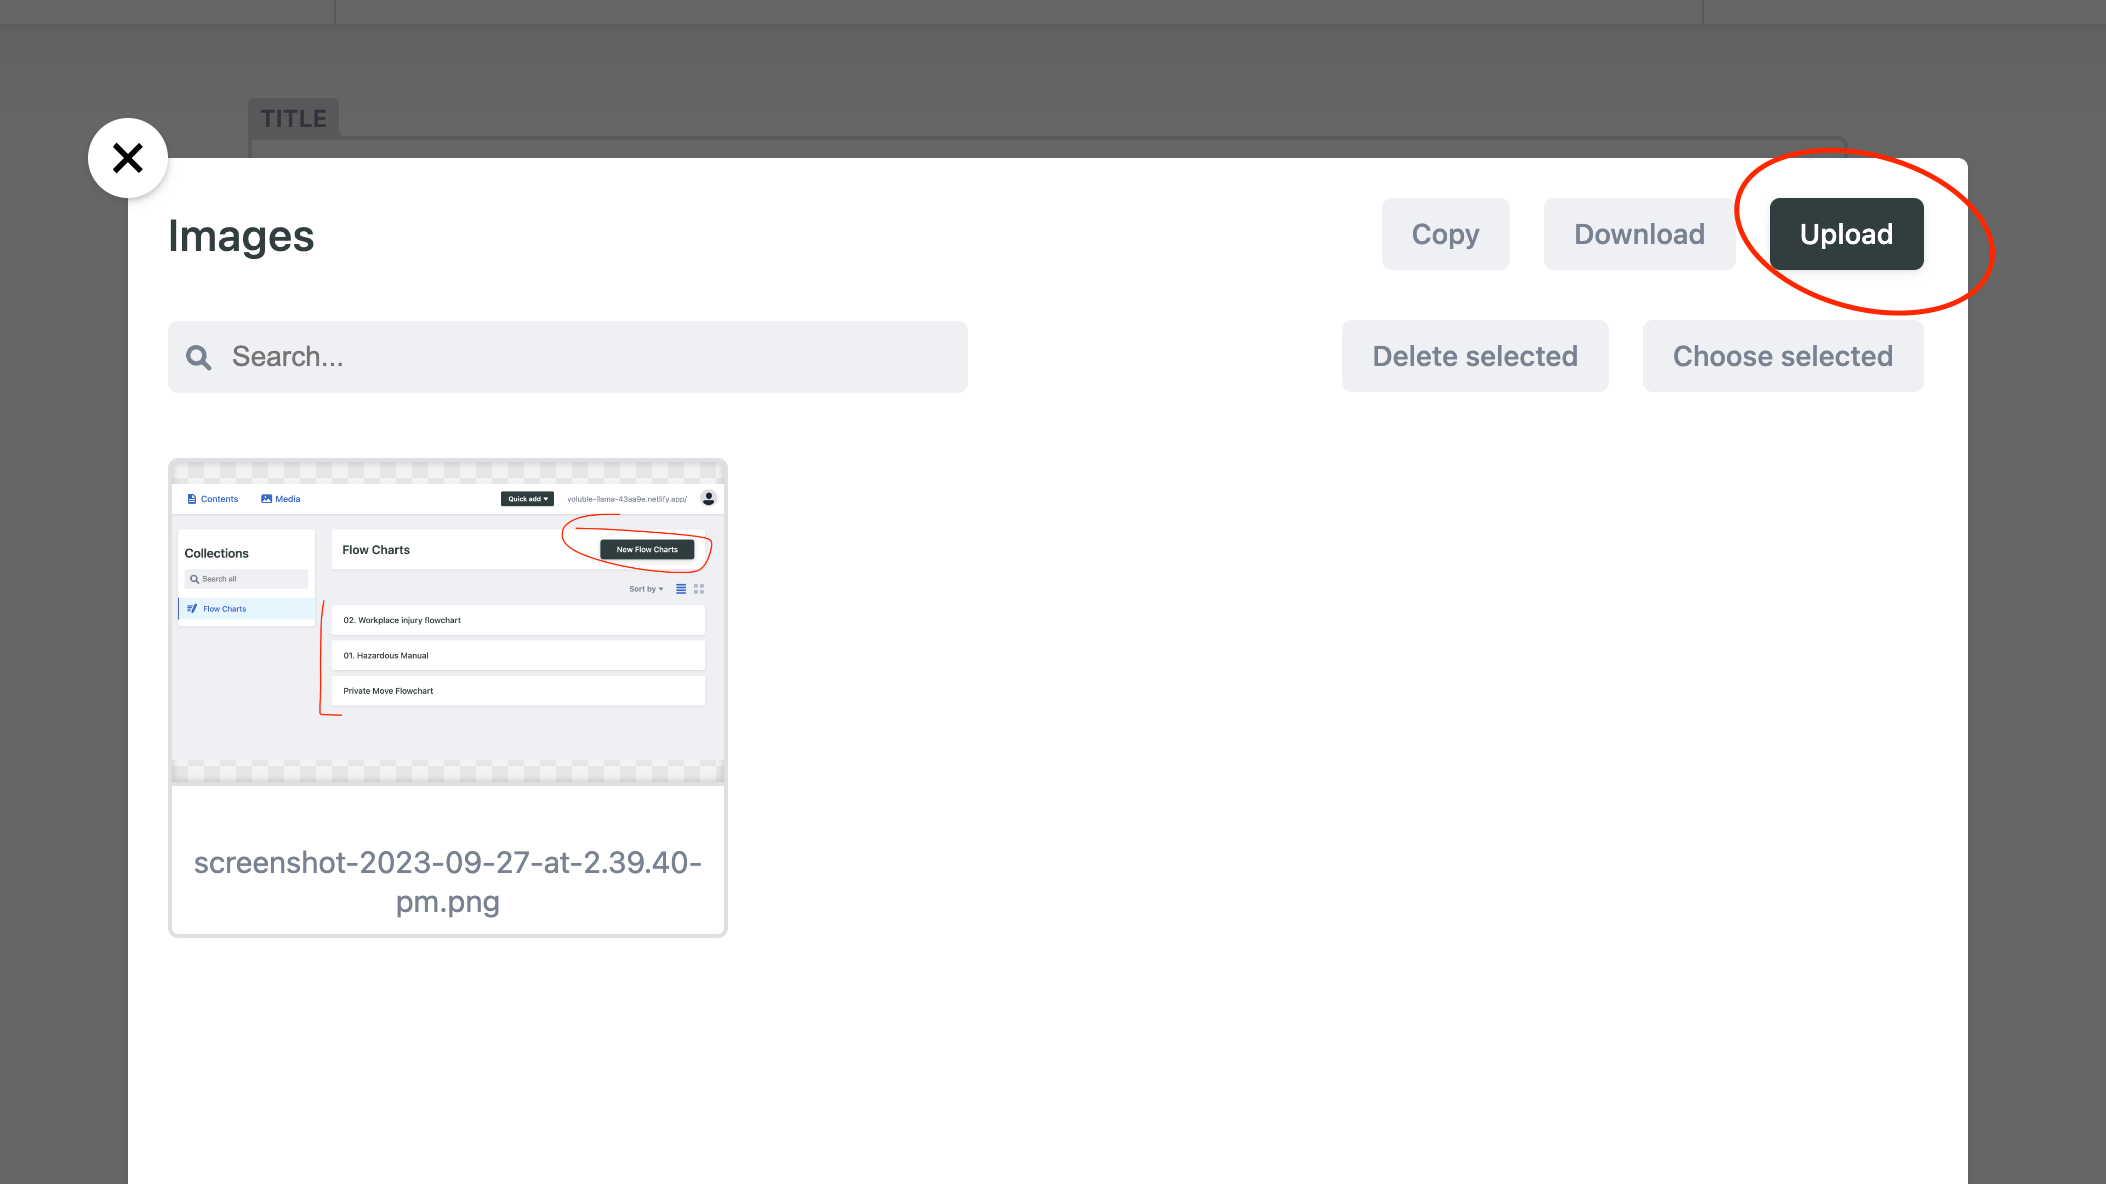
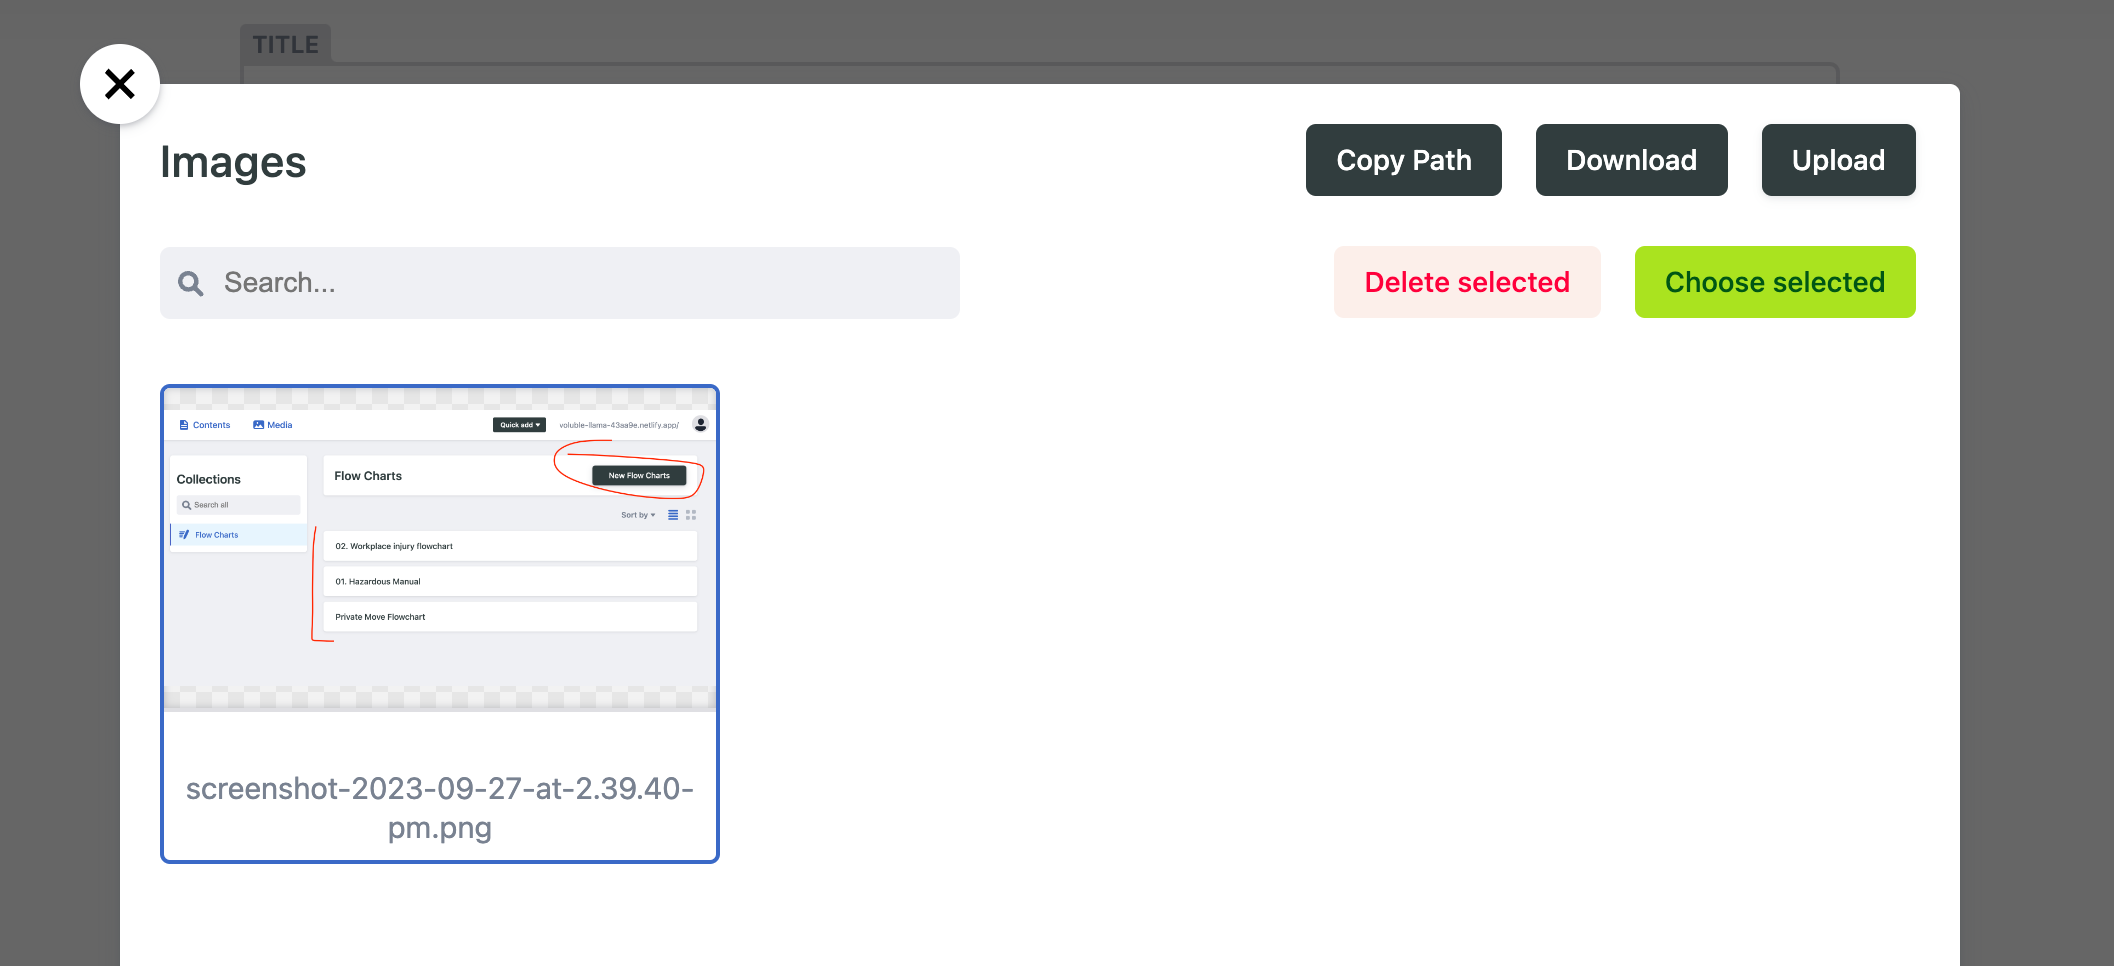
You will be presented with the below widget which will allow you to either upload an image by clicking "Coose an image" or to insert an image from a URL. This allows insertion of images from google drive or similar but is not necessary.
5. Embedding video
Iframes can be embedded into description fields similar to images.
To do so:
- Go to Youtube and find the video you want to embed
- Click the share arrow and then select embed
- Copy the embed code
- Paste the embed code into a description field
6. Adding links
Links can be added by selecting text and then clicking the chain icon in the WYSIWYG editor and then typing or pasting in the link:
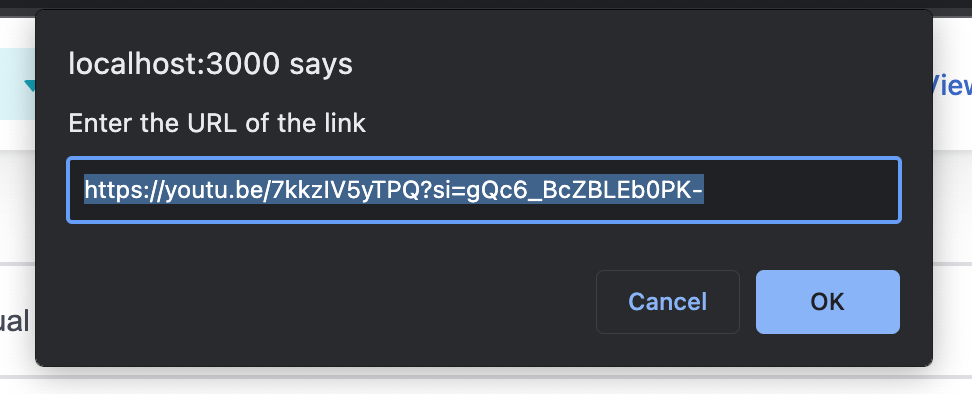
Otherwise links can be added by using markdown like in the image below